 MPAndroidChart
Open source · Android · Kotlin
Every chart your Android app needs.
Line, bar, pie, scatter, candlestick, bubble, radar and combined charts with zooming, dragging, highlighting, markers and animations. A property based Kotlin API, a Jetpack Compose module and one dependency line to get going.
Nine chart types, one way of working
Entries hold the values, a data set holds one series and its styling, the data object holds all series of a chart. Learn it once for the line chart and you know it for all of them. Every card below is a screenshot of the example app's Design section, drawn by the library.
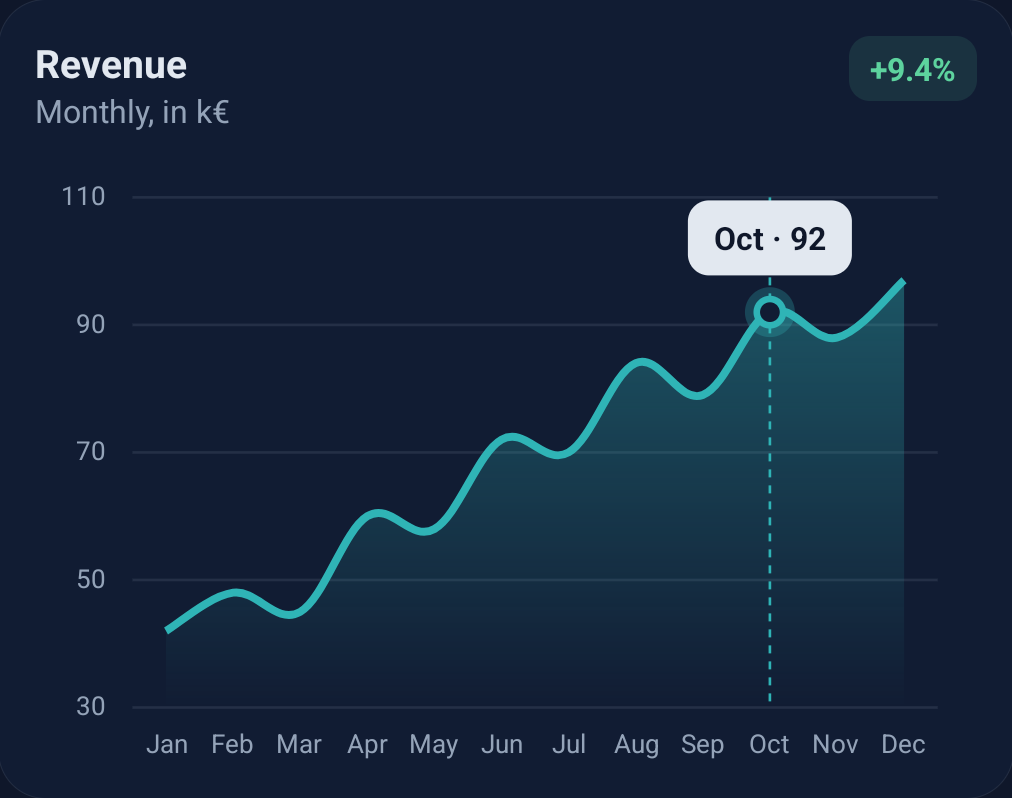
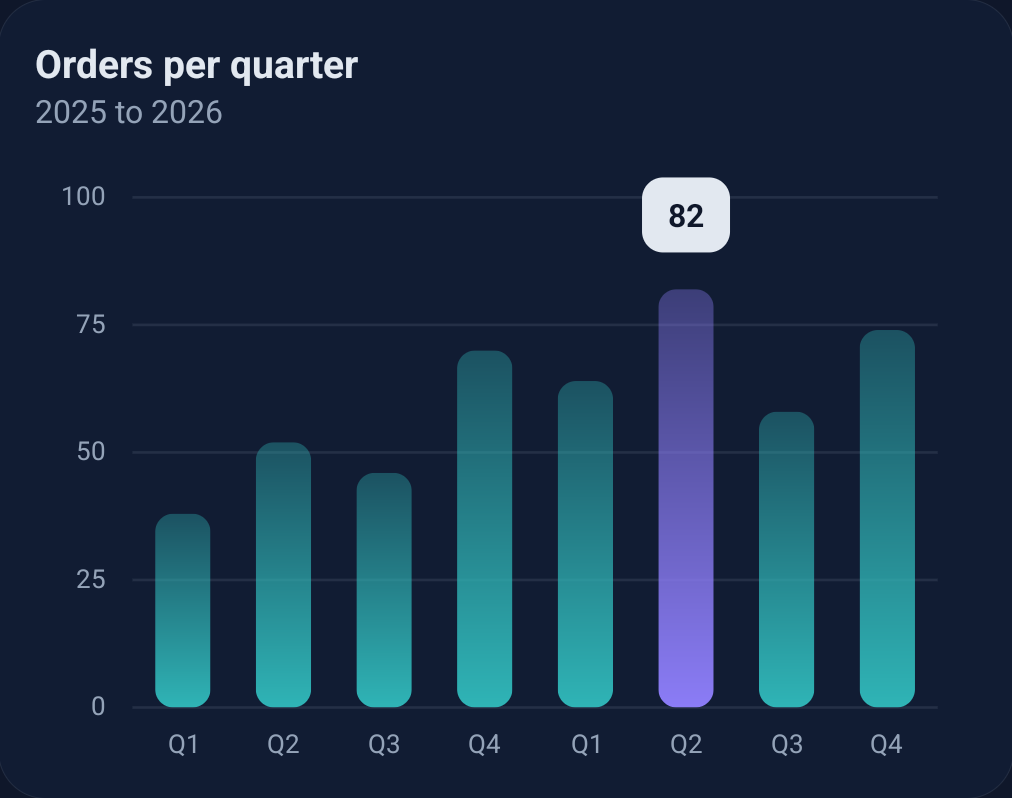
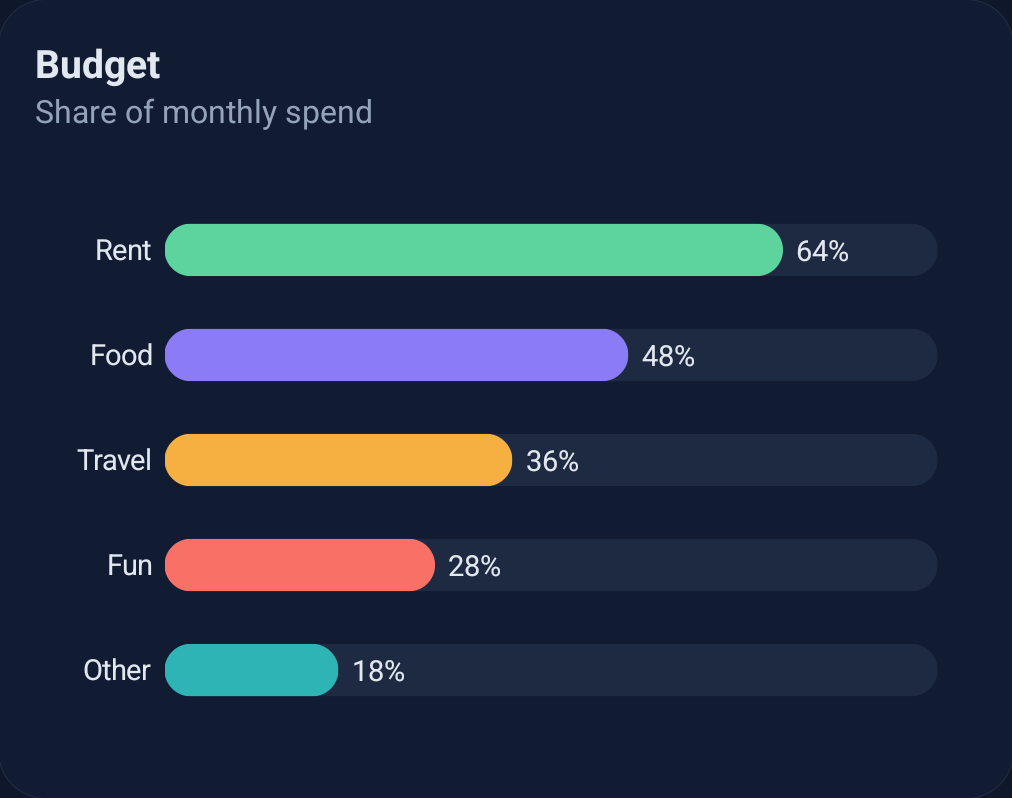
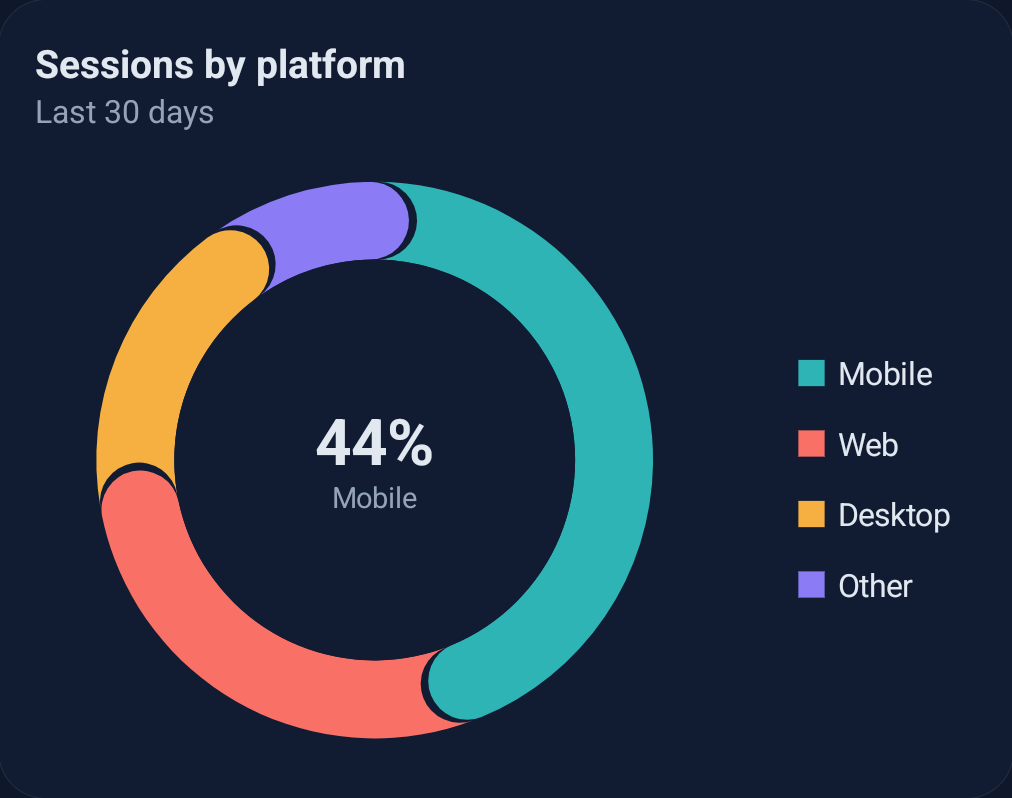
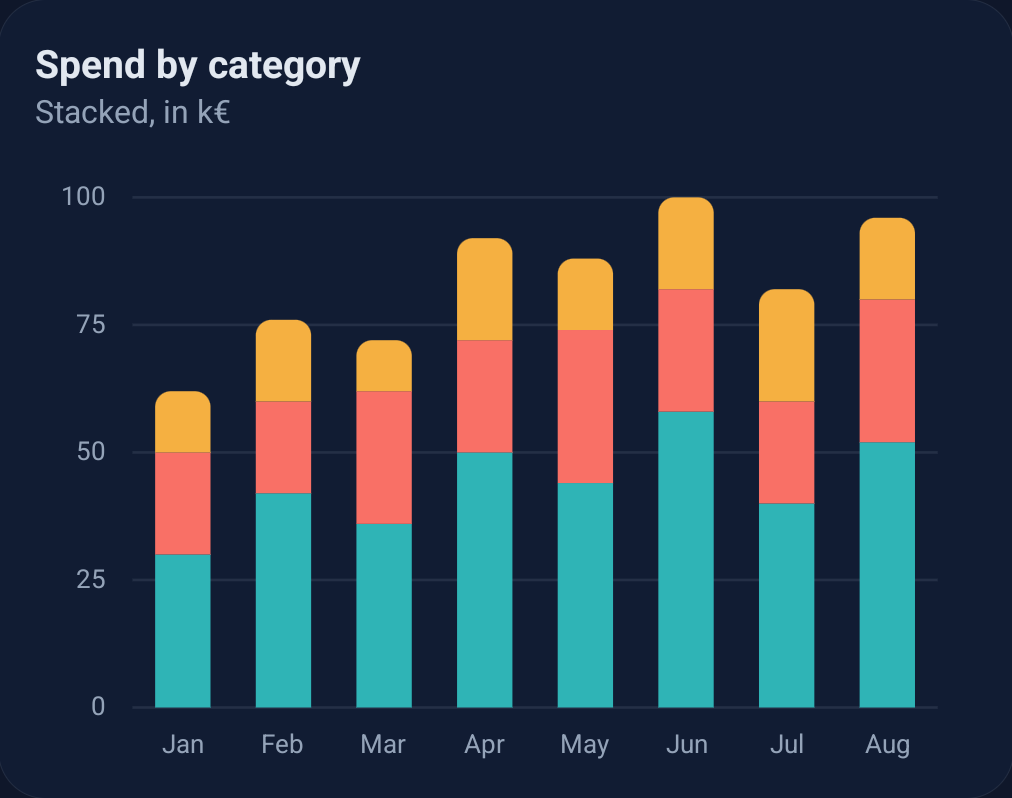
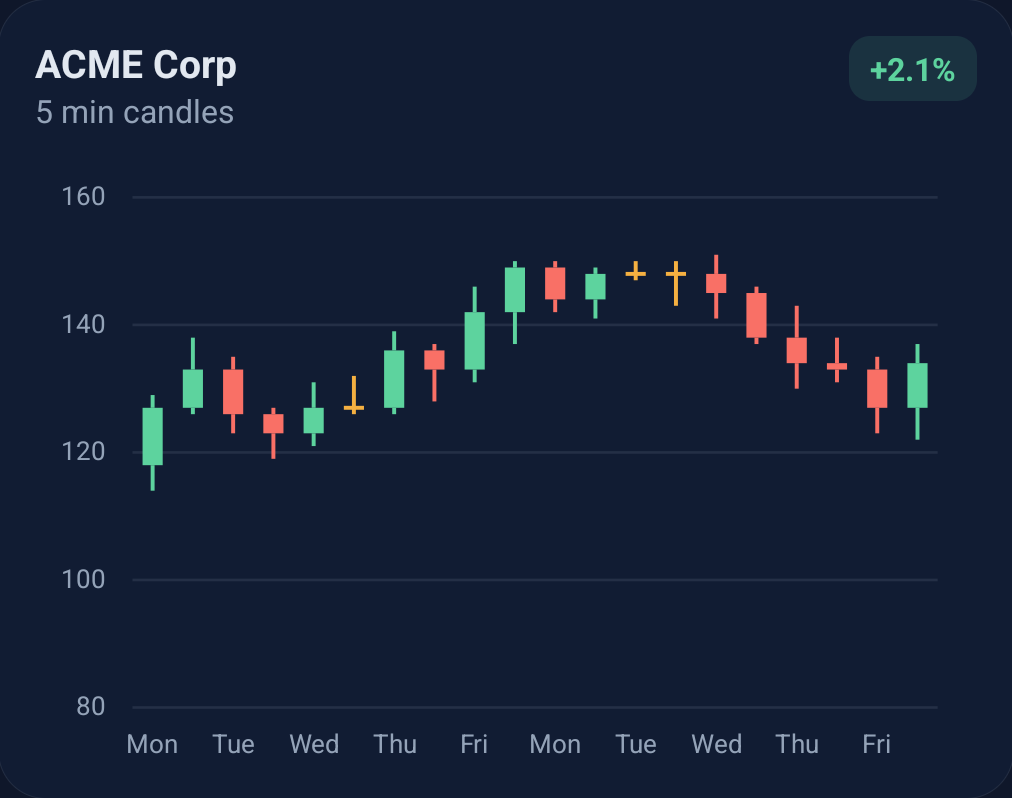
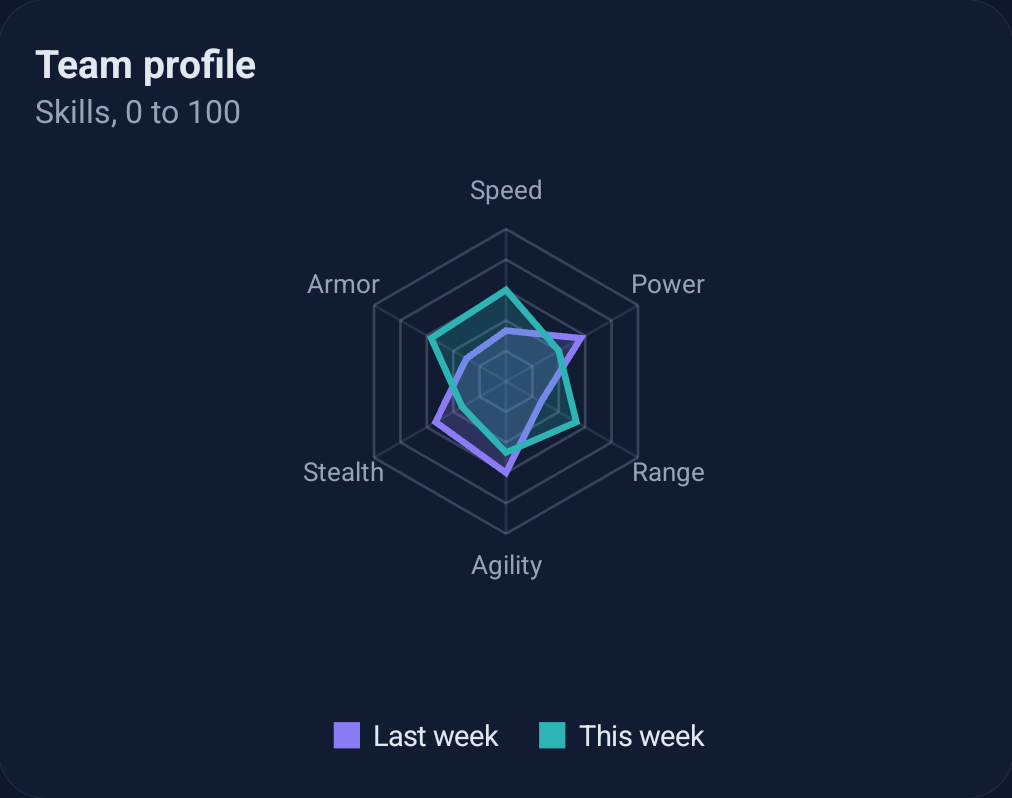
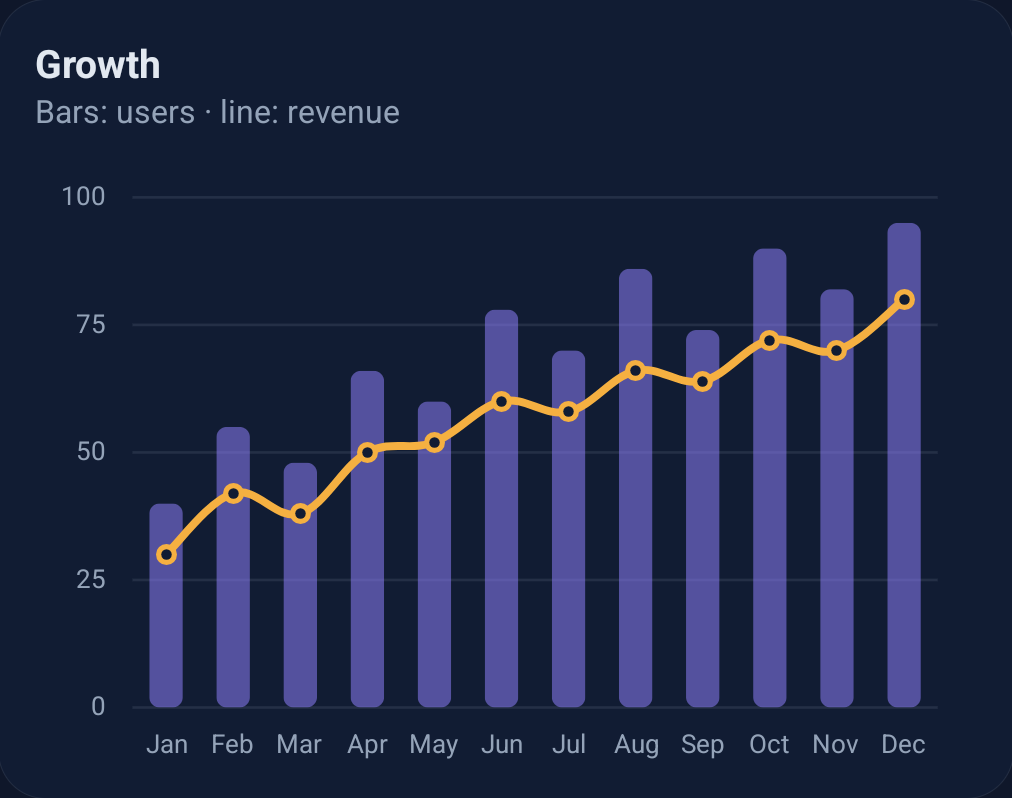
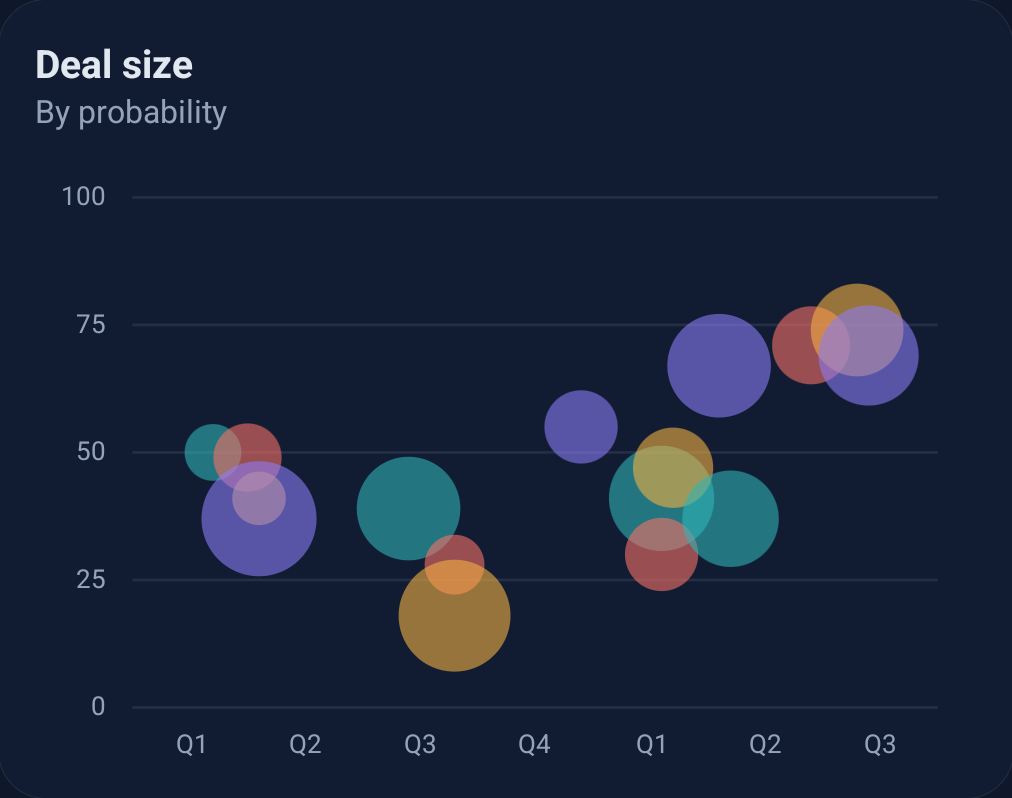
Scatter plots, full width lines, cubic and stepped lines, half pies, negative stacks, realtime data and more are in the example app.
Built for real apps
Jetpack Compose, first class
Every chart type has a composable with the same name. Pass data as state, configure once in setup, and read selection and viewport back through rememberChartState. Markers are composables, previews work, and state survives configuration changes.
val state = rememberChartState()
LaunchedEffect(lineData) { state.animateX(500) }

LineChart(
    data = lineData,
    modifier = Modifier.fillMaxWidth().height(300.dp),
    state = state,
    marker = { entry, _ -> Text("${entry.y}") },
    setup = { axisRight.isEnabled = false },
)
Text("Selected: ${state.selectedEntry?.y}")
Documentation
Quick start
Install, put a chart in a layout or a composable, give it data. The README covers the whole path in a few minutes.
Read the READMEGuides
Thirty five chapters: axes, legends, formatters, highlighting, markers, animations, the viewport, theming, renderers, Compose and troubleshooting.
Read the guidesAPI reference
Every class, function and property with units, defaults, side effects and exceptions, generated from the source.
Browse the APICompose API
The composables, the chart state and the interop helpers of the Compose module.
Browse the Compose APIMigrating from 3.x
Every change from the Java versions, from properties to typed entries, with before and after code.
Read the migration guideExample app
Thirty five screens with source, including the Design section shown above and a Compose screen.
See the sourceGet started
Add the JitPack repository and one dependency, put a chart in a layout or a composable, and give it data.
1. Add the dependency
// settings.gradle.kts
dependencyResolutionManagement {
    repositories {
        maven("https://jitpack.io")
    }
}

// build.gradle.kts
dependencies {
    implementation("com.github.PhilJay.MPAndroidChart:MPChartLib:v4.0.0")
    implementation("com.github.PhilJay.MPAndroidChart:MPChartCompose:v4.0.0")
}
2. Show a chart
val entries = listOf(Entry(0f, 4f), Entry(1f, 8f), Entry(2f, 6f))
val set = LineDataSet(entries, "Sales").apply {
    color = Color.BLUE
    lineWidth = 2f
    mode = LineDataSet.Mode.CUBIC_BEZIER
}
chart.data = LineData(set)
chart.animateX(500)Requires minSdk 23. Apache License 2.0. Questions go to Stack Overflow, bugs to GitHub issues.